Passive 2 - Geometry - Shade
There are several ways of modeling shade in Honeybee. For static elements, the easiest is to simply model the geometry and load it into a Honeybee EP Context Surfaces component.
2.00 - Review The first is to simply draw context geometry, as we did when we added trees and shading elements to the Single Zone Model: 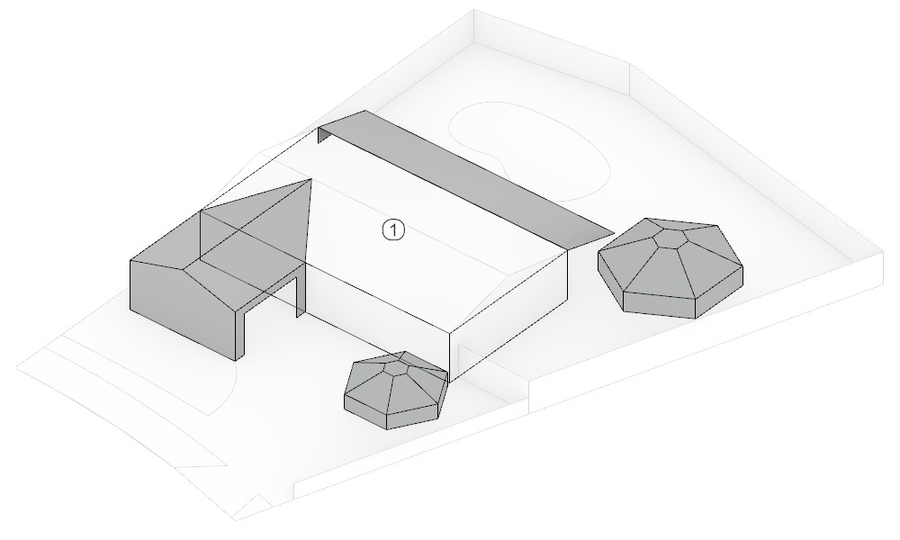
We will plug the shading component into our existing definition here: 
2.01 Zooming in, we can see that this is the exact same module we created at the end of the Single Zone Model. 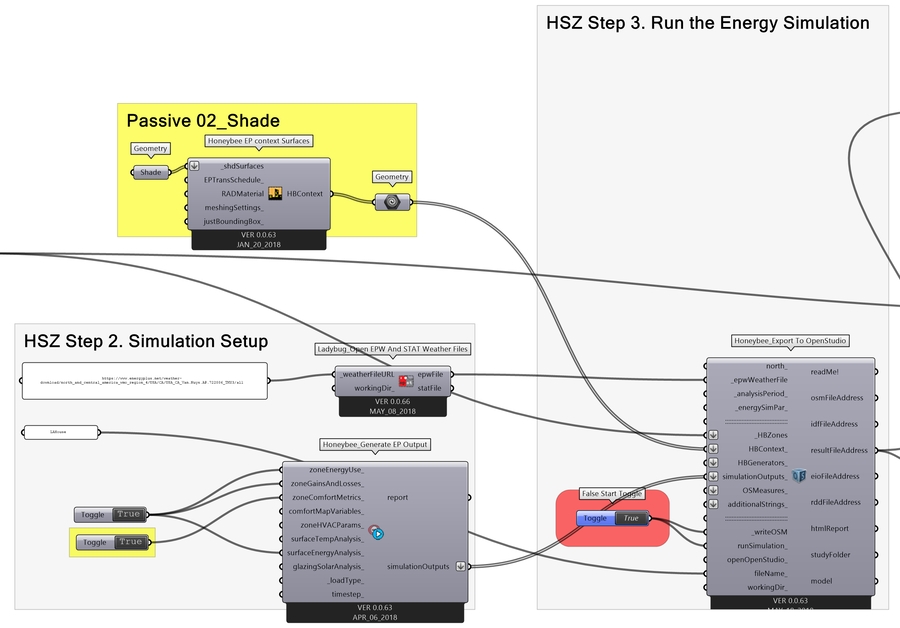 Note these steps are explained more fully here: https://github.com/mostaphaRoudsari/honeybee/wiki/Iterating-to-improve-design
2.02 Once we run the simulations and compare the resulting Energy Balance Diagrams, we can compare the effectiveness of shading the house versus replacing the windows with high performance glass. 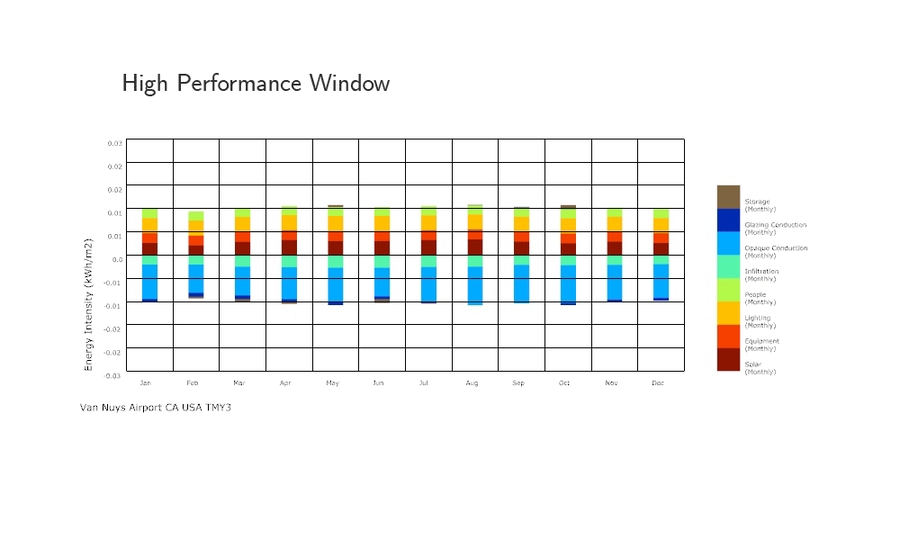
2.03 Why is this the case? Using Ladybug's Skydome component, it is possible to visualize where in the sky this solar radiation originates. It provides us a diagrm like the one below. This diagram is to be read as a sphere projected flat in plan. It subdivides the sky into 145 areas, and measures the overal amount of solar radiation originating from each area of the sky dome. 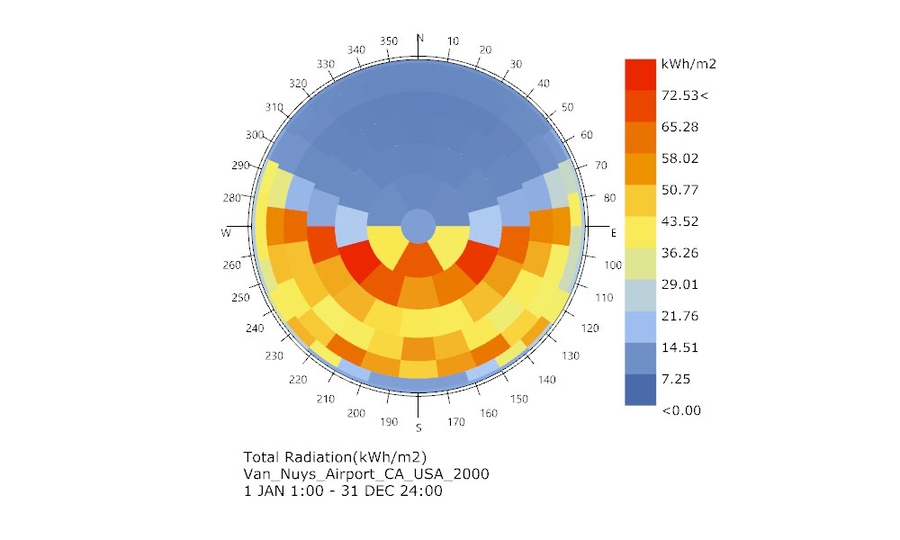 A full explanation of the Ladybug_skyDome component is beyond the scope of this tutorial, but you can download an example file on Hydra.
Download example file on Hydra.
2.04 Here is an axonometric view of the same diagram, which is easier to read spatially. 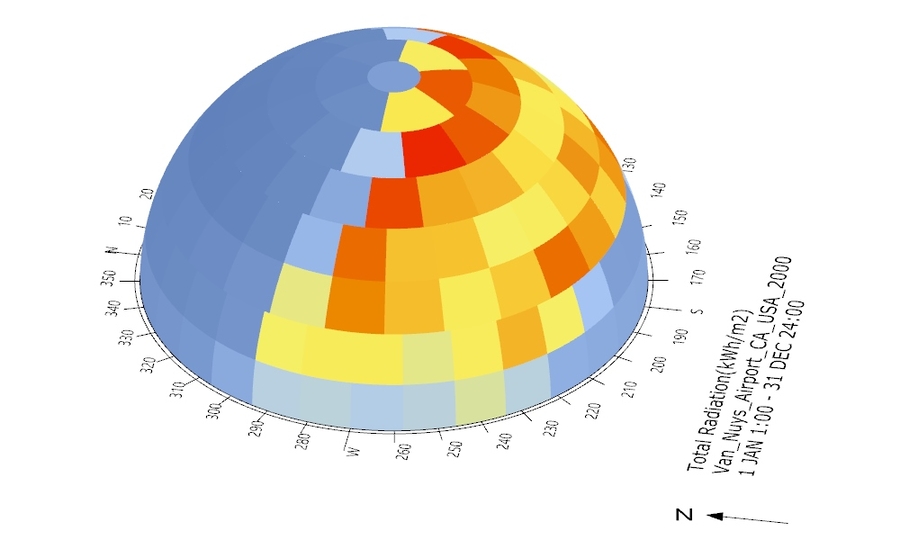
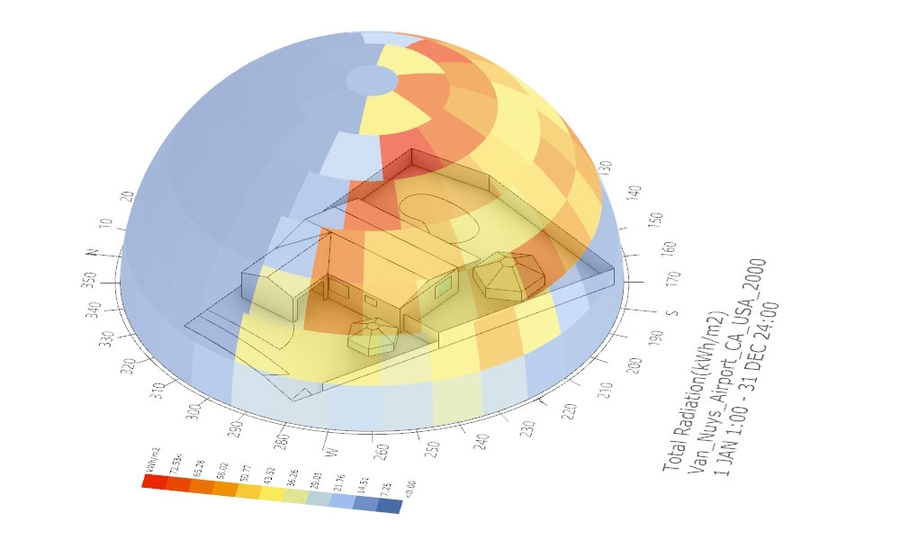
2.05 If we overlay this diagram on our model, we can see that the canopy protecting the eastern side of the house is fairly effective, but the south and west sides of the house are left unprotected. This is the primary reason that high performance windows are more effective than shading in the analysis above. We can also see that some of the most intense sunlight arrives from an altitude that is too acute to be shaded by the trees.
Last updated
Was this helpful?