Step 5 - Iterating to improve design
We will now illustrate how you can use the model to explore potential design strategies.
5.00 This will require three changes to the script we completed in Section 4. The changes are highlighted in yellow below:
You can download a version with the changes on Hydra. 
5.01 The very first thing we will do is apply a high and low bound to the graph, so that our results are drawn on the same y-axis and are therefore comparable to one another. Connect two panels to the Ladybug_Legend Parameters component containing .03 and -.03 as shown below: 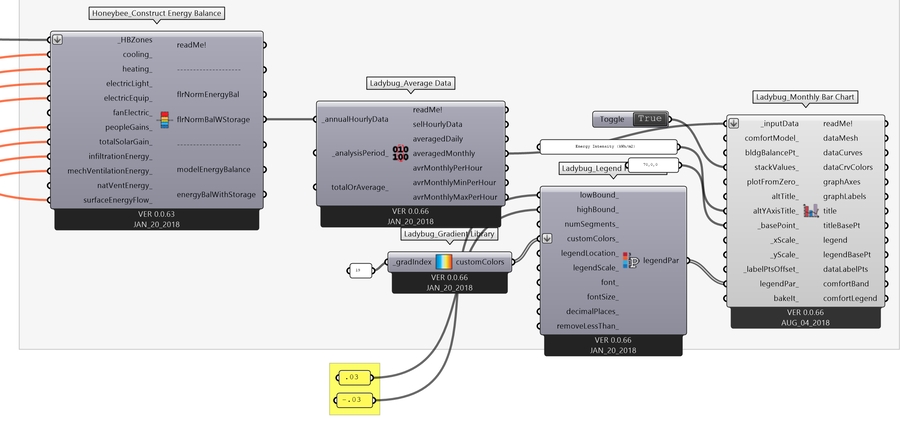
5.02 You might imagine that the Energy Balance Diagram describes the work done by mechanical systems, but it is actually broader than that. It describes all heat moving in and out of the zone. To illustrate this point we will change the zone to being unconditioned, which results in an Energy Balance Diagram that describes the house with the air conditioning and heating systems switched off. In the Grasshopper script, this is achieved by connecting an additional false boolean toggle to the Mass2Zones component: 
5.03 If all the boolean toggles which are grouped red (indicating that they trigger a calculation) are still set to True, then the changes made in 5.01 and 5.02 should automatically re-run the simulation. You should now see the following Energy Balance Diagram in the Rhino modeling space: 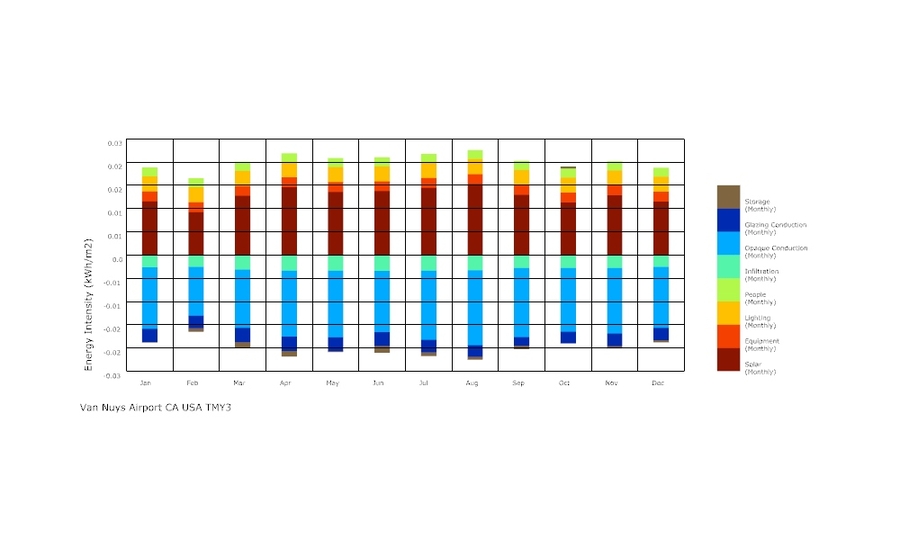
5.04 Compare this to our first Energy Balance Diagram (below). The tallies for monthly cooling and monthly heating are gone. 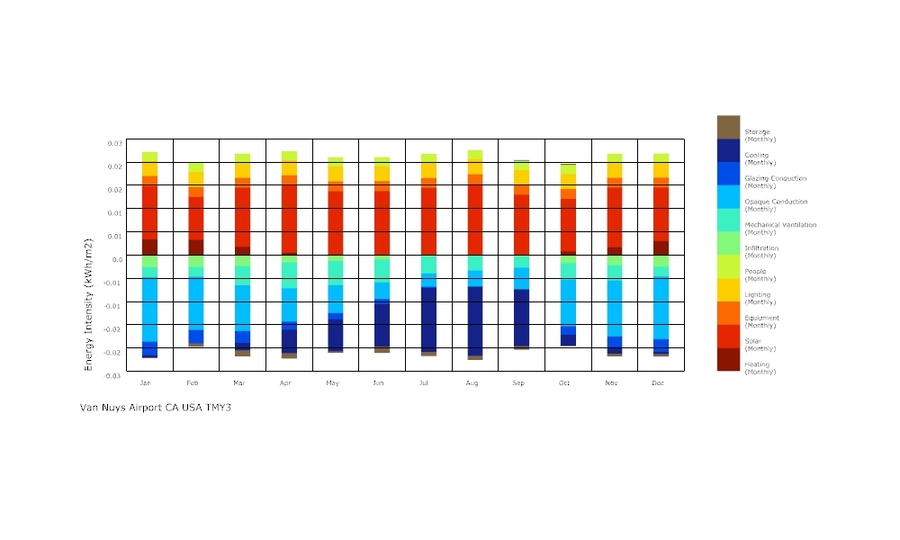
5.05 We can also see that the component of heat gains to the zone is still dominated by the sun, so next we will account for context which shades the house to our model. Recall our original model: 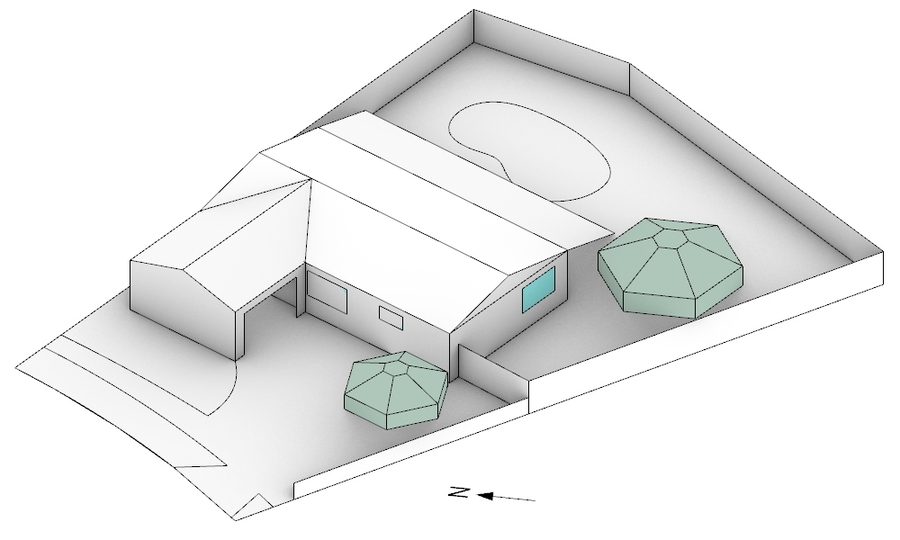
For sake of simplicity, we will ignore the effect of the attic space in the roof. These are the elements we will add to the shading component: two trees to the south, an extension of the roof to the south, and the car port entrance on the northern side. 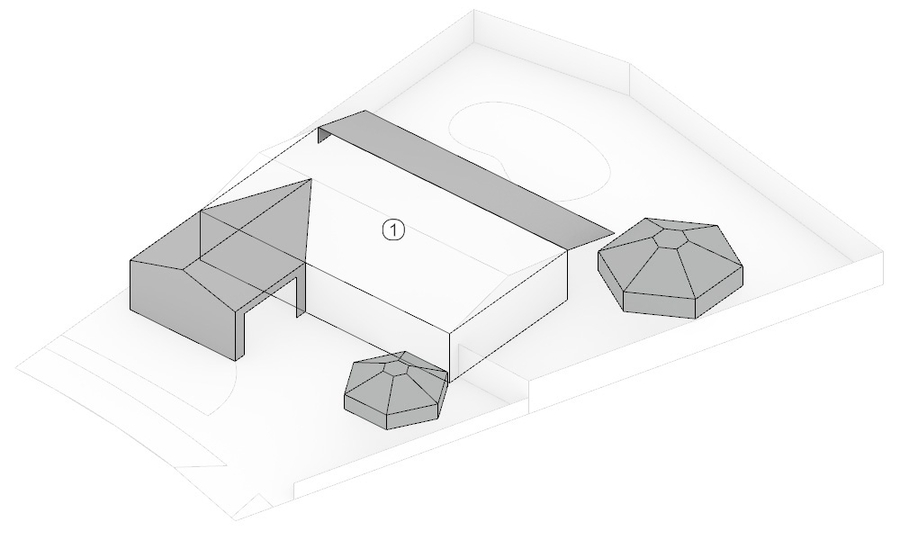
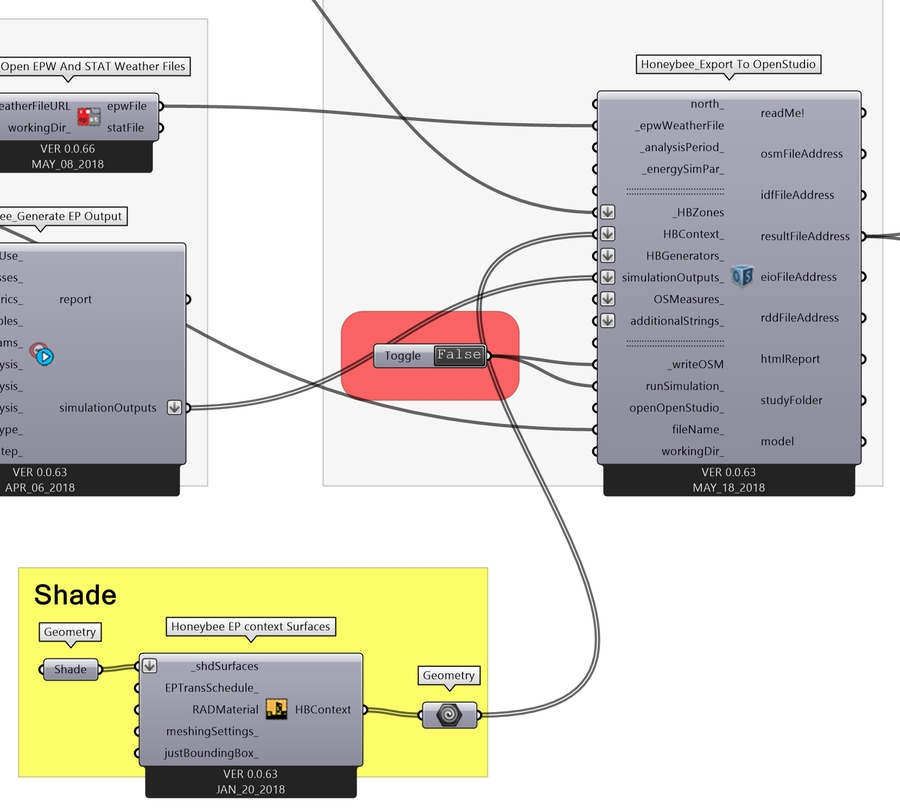
5.06 In the grasshopper script, this is achieved by creating a geometry component, placing the geometry from 5.05 in that component, and connecting it to a Honeybee EP Context Surfaces component, which then is connected to the Honeybee_Export To OpenStudio component. See the central group highlighted in yellow below:  Here is a zoomed-in view that is more legible.:
5.06 You can now see that the solar contribution to heating is dramatically reduced. 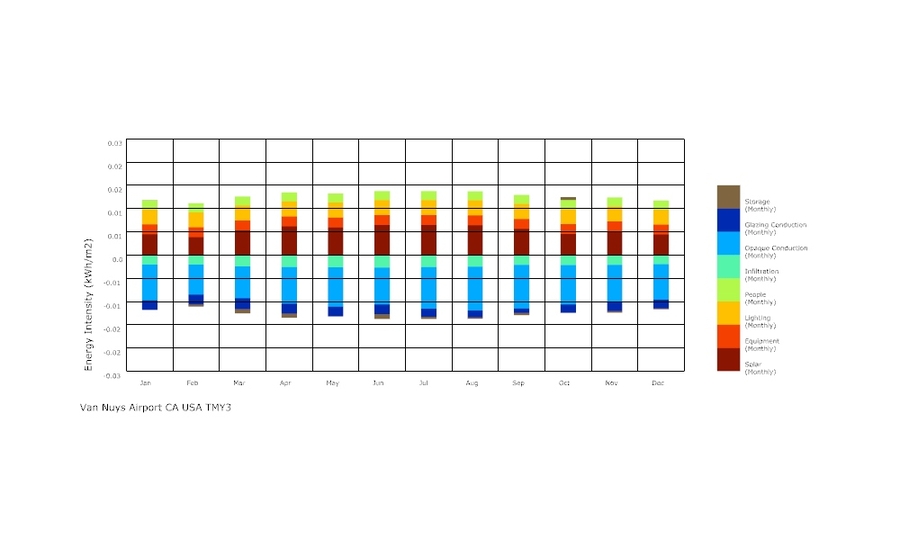
This concludes the section on iterating to adjust the results of our initial single-zone model. You have now begun to make comparisons between different design options using an Energy Balance Diagram.
Last updated
Was this helpful?