
Step 4 - Visualize the results
 Energy modeling draws upon the First Law of Thermodynamics, which states that energy can never be created or destroyed. This diagram summarizes the sources of heat entering and leaving the zone. Heat entering the zone might include heat from people, heat from computers/appliances, heat from light bulbs, solar heat through windows, and heat from heating systems like radiators. Heat losses from the zone might be the result of conduction through the envelope, cool air seeping through walls, or deliberate ventilation. Everything above zero is heat entering the zone, and everything below zero is heat leaving the zone. These must always be equal.
Directing your attention toward the final part of the example file script: 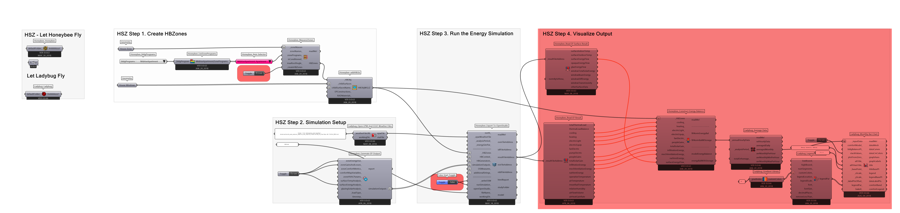
4.00 Begin with the result file from Step 3. 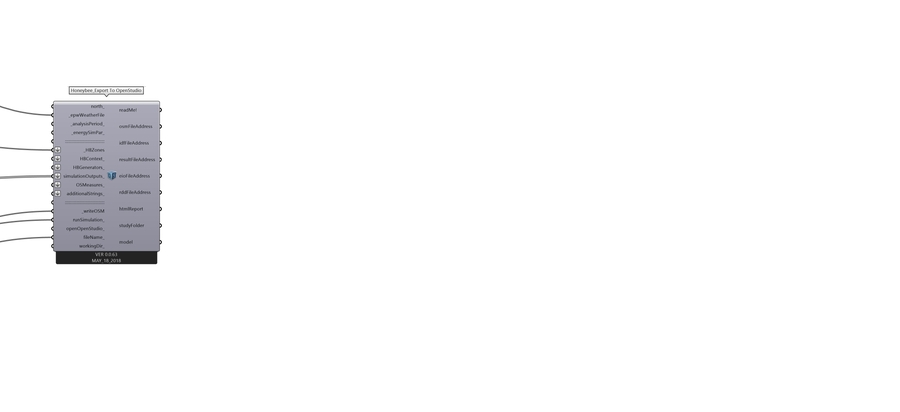
4.01 The result file is a huge comma separated values document, so we use a Honeybee-10-Honeybee_Read EP Results component to separate out each of the simulation results we are interested in visualizing. 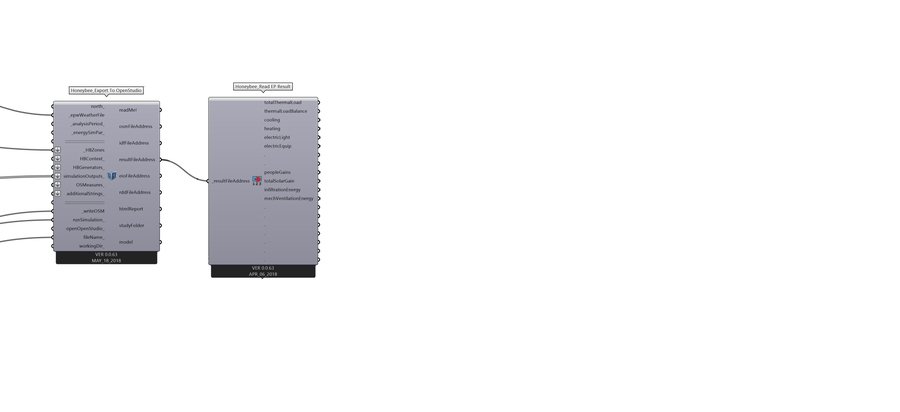
4.02 You can see that each of these results is a list containing 8767 values. The first seven items in this list are the 0) the key, 1) the location, 2) the data type, 3) the units, 4) the frequency, 5) the start date (Month, Day, Hour), and 6) the end date (Month, Day,Hour). The remaining 8760 items are for each hour of the year. 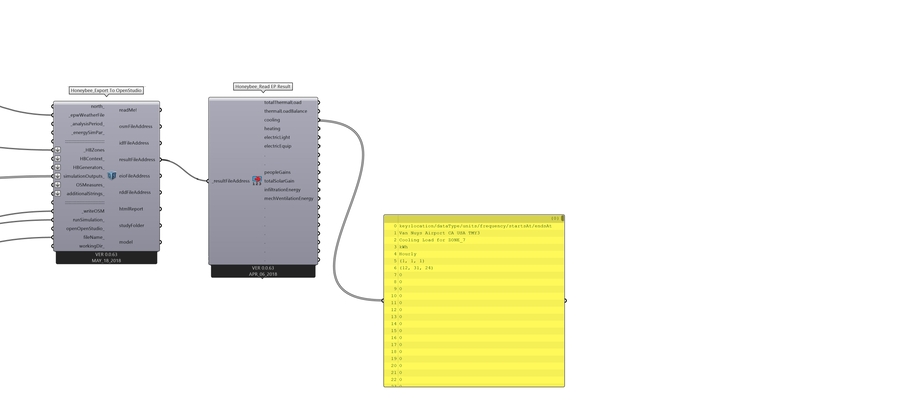
4.03 These hourly results are all compiled in the Honeybee_Construct Energy Balance component. 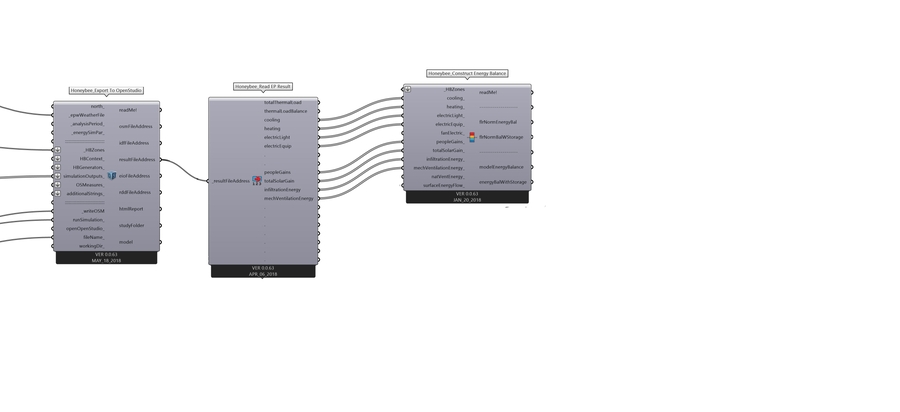
4.04 Which also requires the zones we created in step 2 in order to match these itmes to the zones of interest. 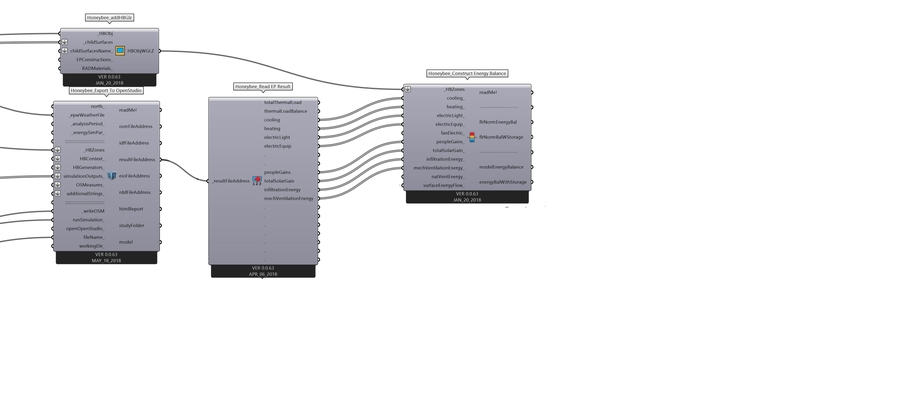
4.05 Althought we have the zones, and we have the overall amount of heat moving in and out of the building, we do not yet have the information necessary to identify the contributions of individual zone surfaces. For this, we need the Honeybee-10-Honeybee_Read EP Surface Results component. 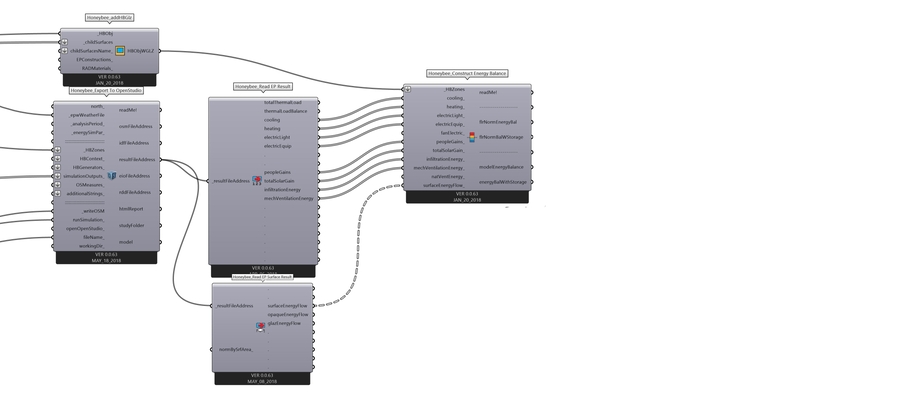
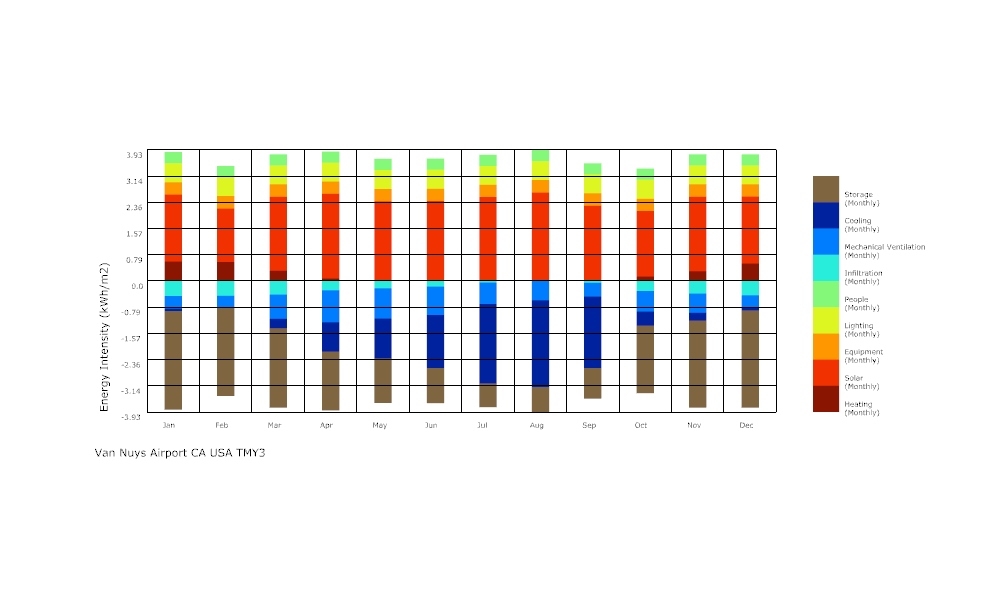
 The Param viewer tells us how many lists are contained in a data stream, and how many items are in each list. We can see that the cooling hourly data is a single list of 8676 values. However, the output of the Honeybee_Construct Energy Balance component contains ten lists with 8767 values each. These lists collect all the other lists into a list of lists. These ten lists represent 0) Heating, 1) Solar, 2) Equipment, 3) Lighting, 4) People, 5) Infiltration, 6) Mechanical Ventilation, 7) Opaque Conduction, 8) Cooling, and 9) Storage. Notice these are numbered starting at 0, this is a convention in most coding languages.
4.07 To visualize the data on a monthly basis instead of a daily basis, we will use the Ladybug_Average Data component to make the conversion. 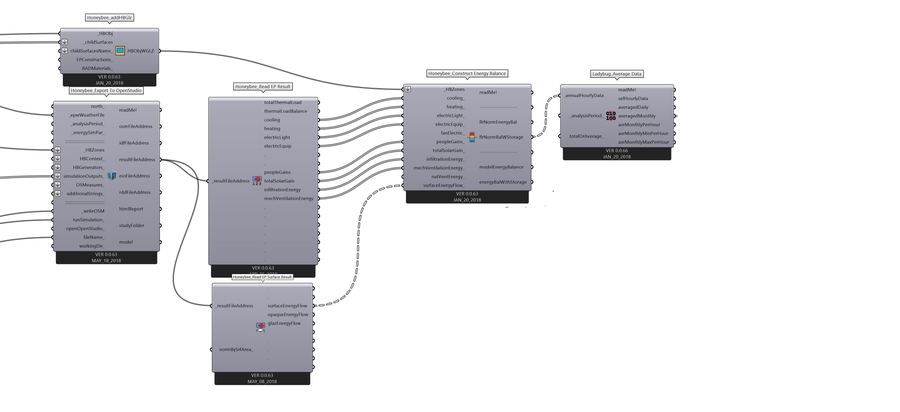
4.08 Observe that each of the lists that once contained 8767 values now contain just 19 values each. (7 for information about the data + 12 for each month of the year) 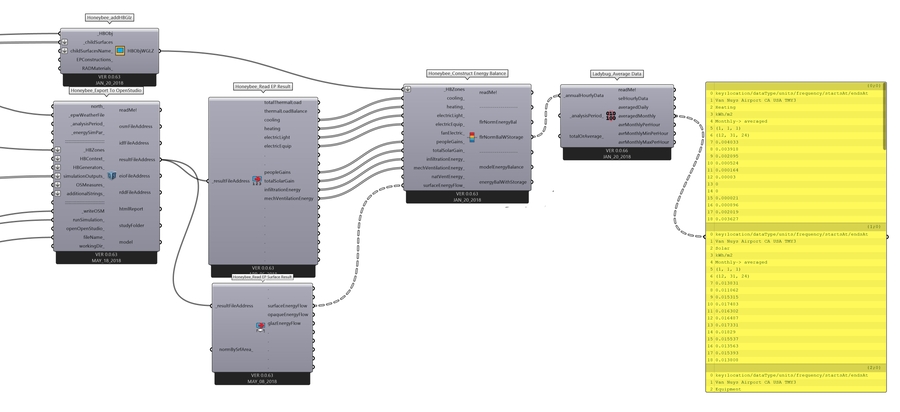
4.09 Finally, we have the data in the right format for a monthly bar chart. Drag a Ladybug_Monthly Bar Chart component onto the canvas. 
4.10 Use a boolean toggle in the True position to stack the values on the chart. 
4.11 Use a Panel to label the Y Axis with 'Energy Intensity (kWh/m2)'. 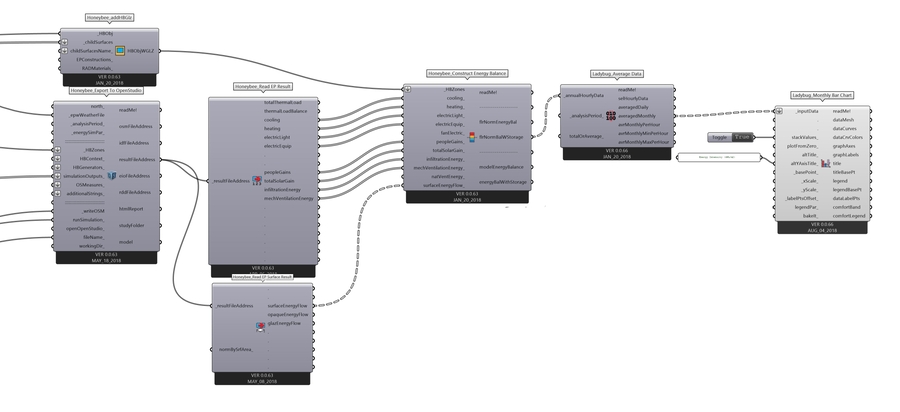
4.12 Use another Panel to set the base point of the chart to (70,0,0). 
4.13 Finally, we will adjust the color of the chart using a Ladybug_Legend Parameters component. 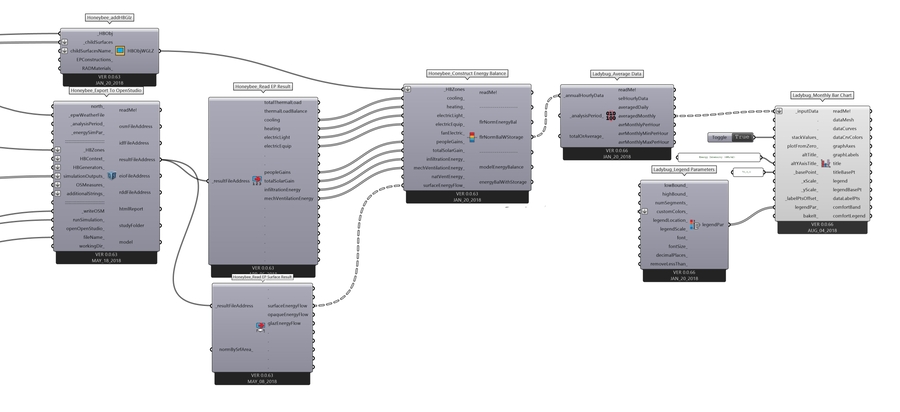
4.14 We'll take item 19 of the Ladybug Gradient library, which has been designed for Energy Balance visualizations. 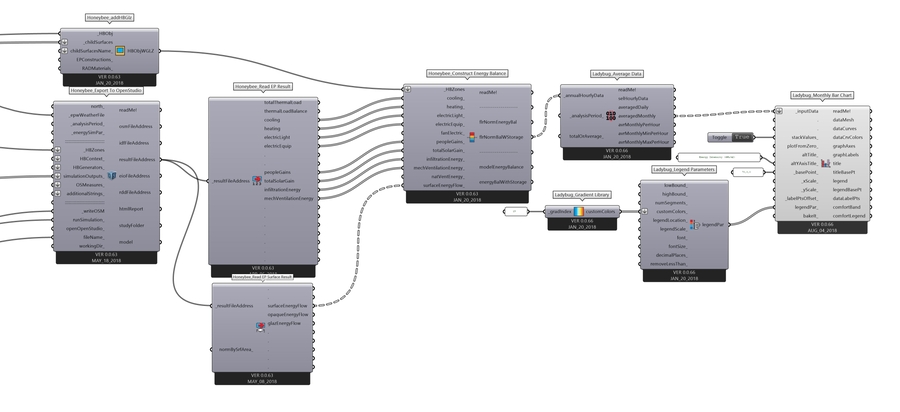
4.15 Rhino's modeling space should now contain an Energy Balance Chart.  This represents a simulation of a very simple box model, as pictured below. We have not yet accounted for context.
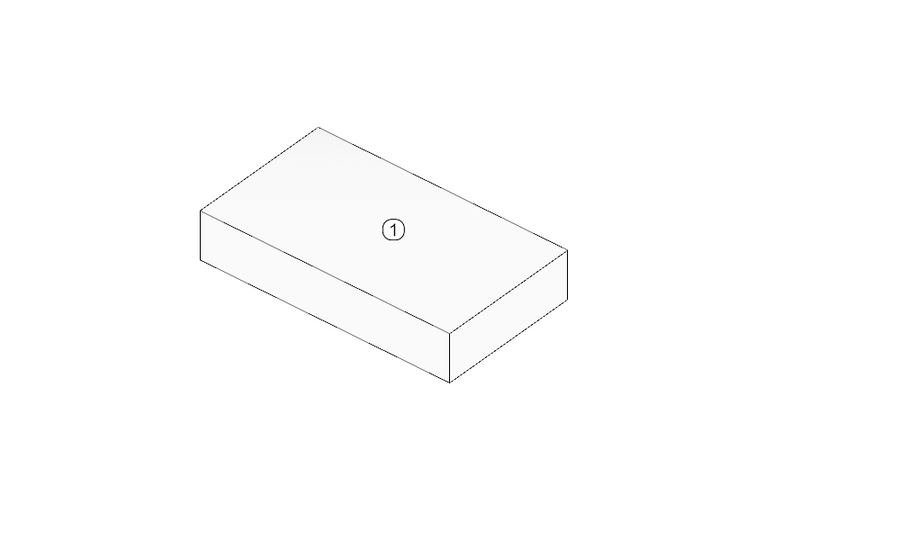
4.16 As a demonstration, try disconnecting the wire highlighted in red below. This will remove the surface calculations from the Energy Balance Diagram. In layman's terms, this is removing the component of the calculation that accounts for the heat conducted through each individual surface of the zone, meaning that all the heat which the simulation expects to be conducted through the wall now appears as simply being stored in the material. 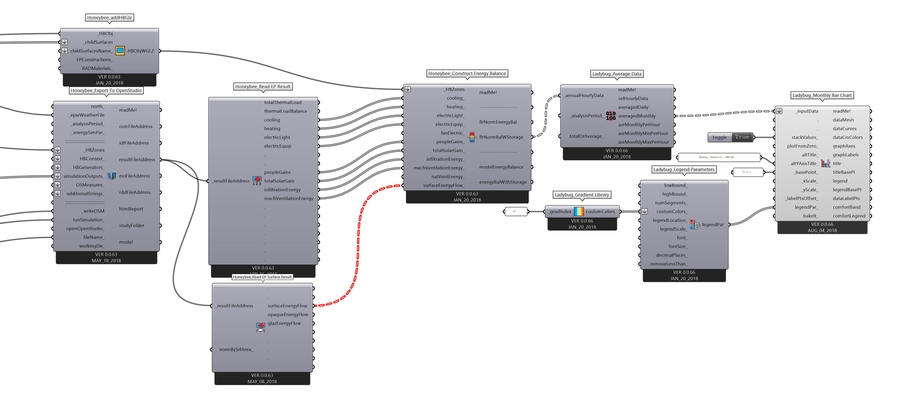
Last updated
Was this helpful?