Step 3 - Run the model
Last updated
Was this helpful?
Last updated
Was this helpful?
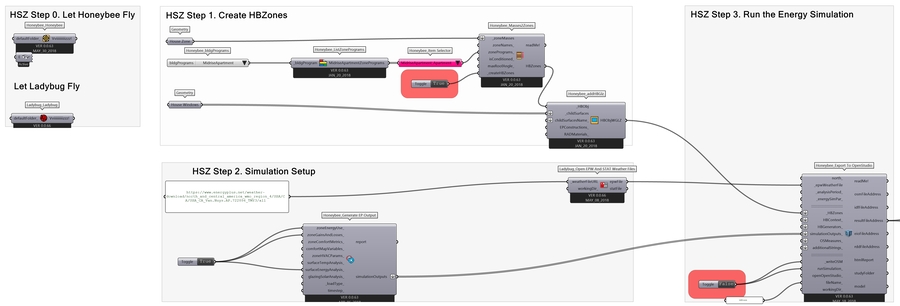
The next step of the process is collecting the information we have entered thus far to run our first energy simulation. We focus on Step 3, highlighted in red below:
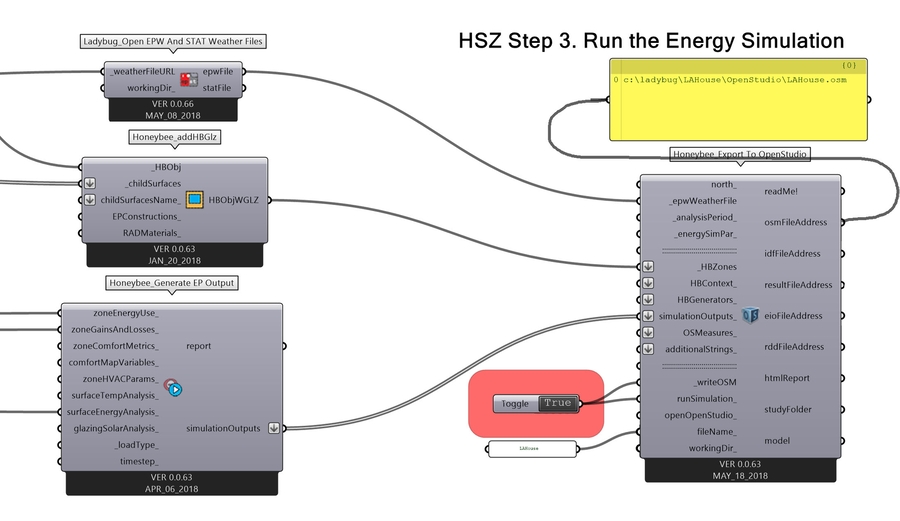
Zooming in, observe that we will connect outputs from both Step 1 and Step 2.
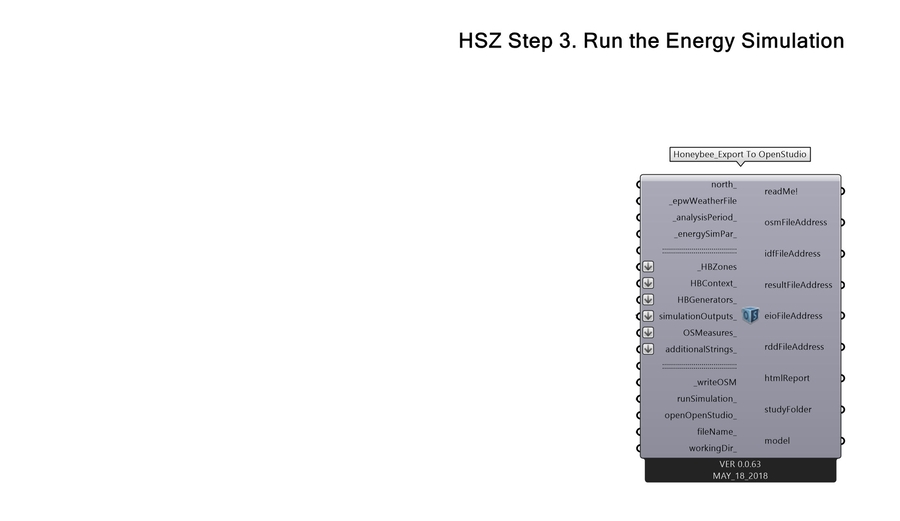
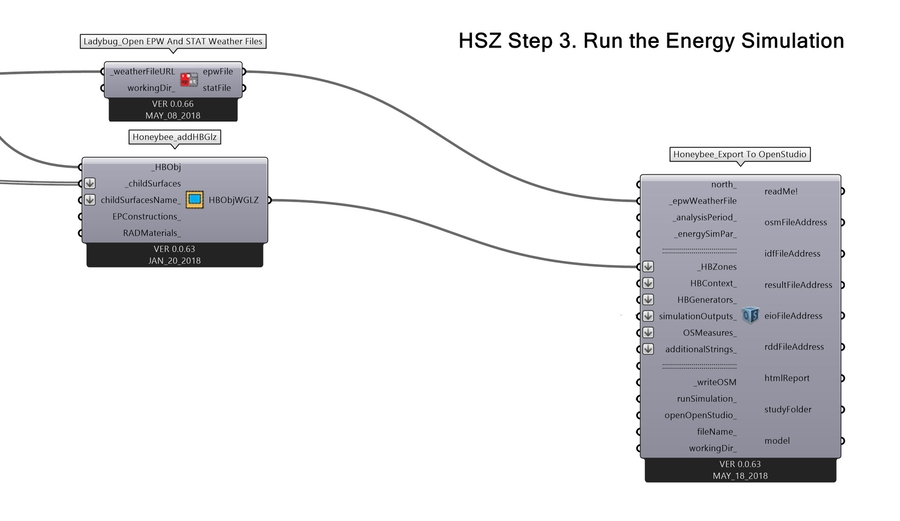
3.00 The key component for this process is the Honeybee-10-Honeybee_Run Energy Simulation component, which collects all the inputs we prepared, fills in the blanks with default values, and prepares a set of instructions for the OpenStudio simulation engine. This set of instructions is saved in the form of an OSM file. After we have run the simulation, we will show you what an OSM file looks like.
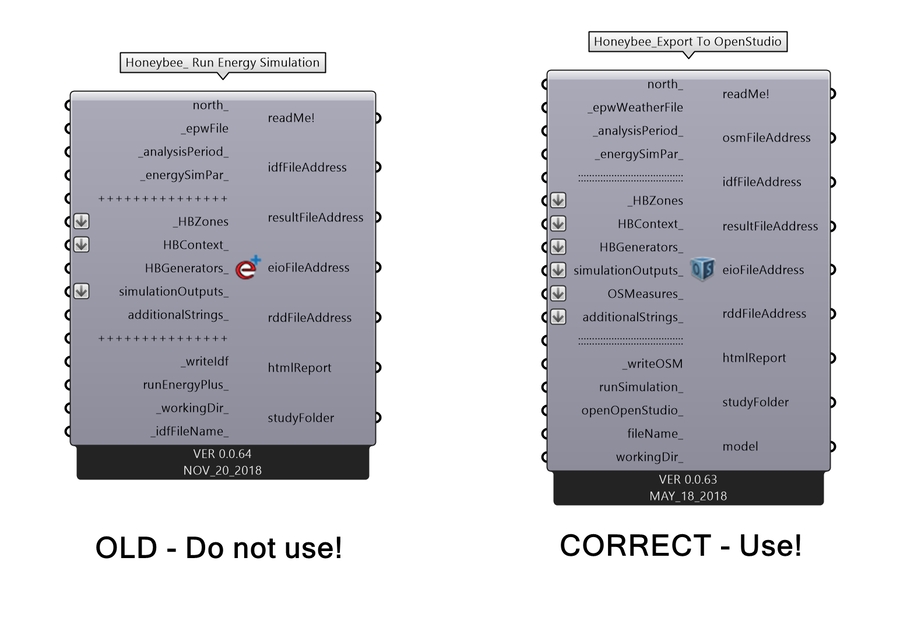
Note on versions: Do not confuse the Honeybee_Export to OpenStudio with the out-dated Honeybee_Run Energy Simulation component! The OpenStudio component does everything the old component does and more. We retain the old component in the Honeybee library only for the sake of allowing users to continue using scripts that are already written The relationship between the OpenStudio component and the old EnergyPlus only component is related to the development of Honeybee more generally, as described in the following two diagrams. OpenStudio acts as a hub between Honeybee and EnergyPlus, which expands the set of functions and features from those available in EnergyPlus alone.
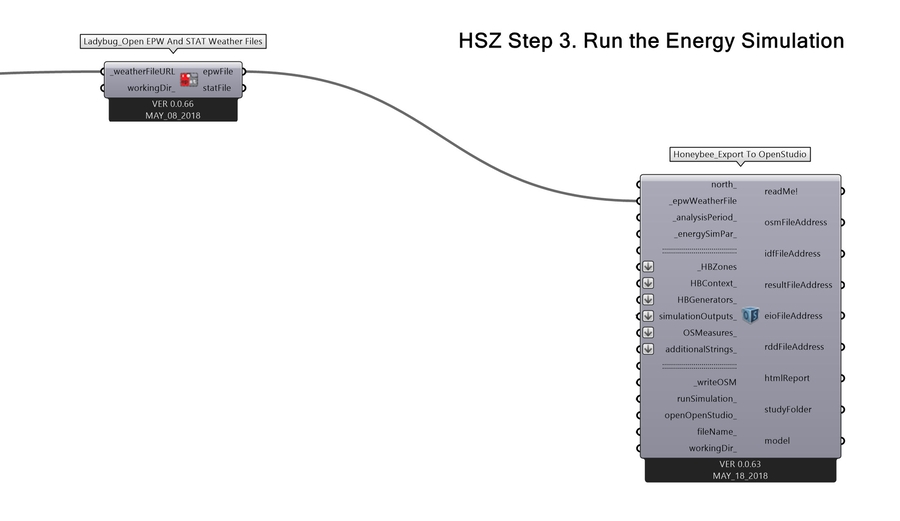
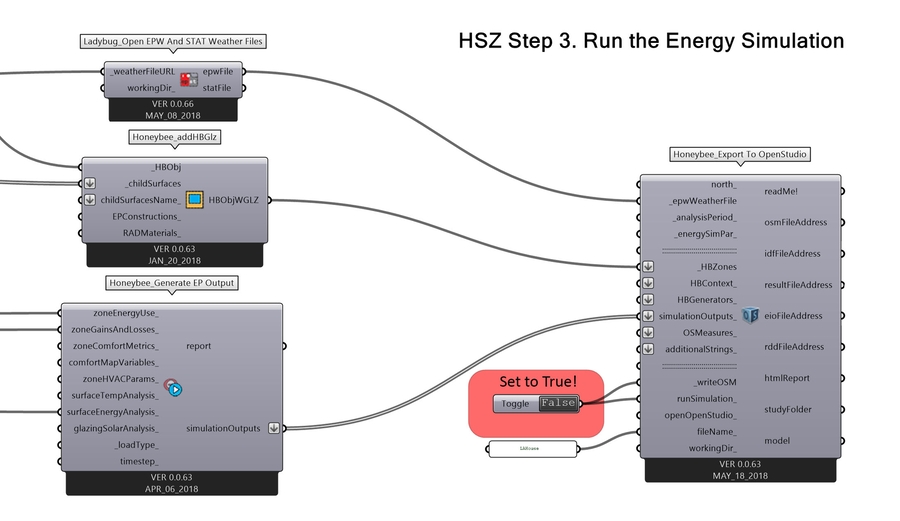
3.01 Connect the EPW Weather File from Step 2 to the Honeybee_Export to OpenStudio component.
3.02 Connect the Zones that have Windows as 'children' from Step 1.
3.03 Connect the list of desired simulation outputs from Step 2.
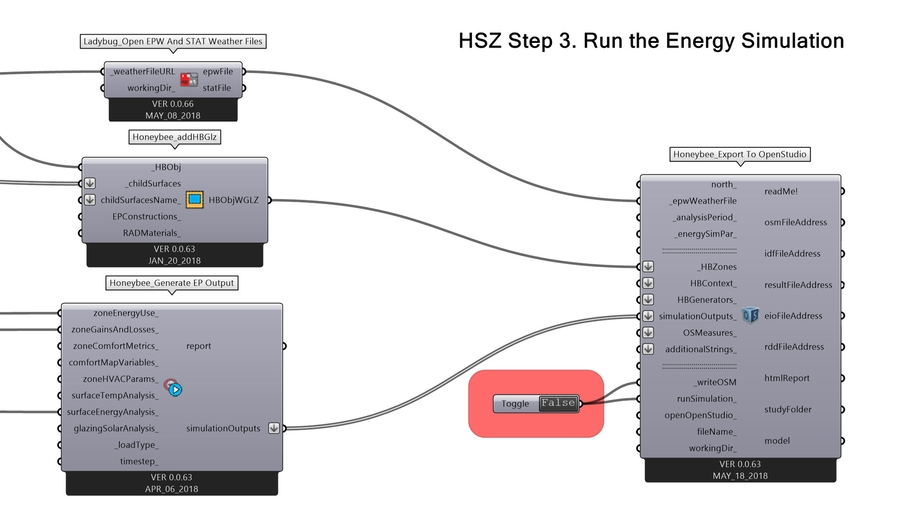
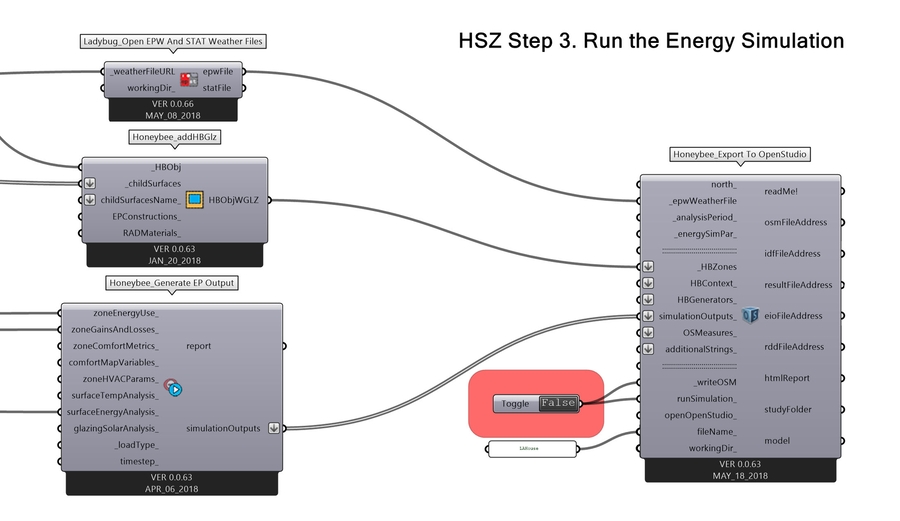
3.04 We will need a boolean toggle to run the simulation, but don't change it to True just yet! We will use the same boolean toggle to tell Honeybee that we'd like to save a copy of the OSM file that contains all the settings for our simulation. Note that it is connected to two terminals in the diagram below:
3.05 We will also specify a name for the simulation output file. This makes it possible to save the output instead of over-writing it each time. Use a panel to do this. We name the file LAHouse.
3.06 Finally, change the boolean toggle to True to run the simulation. This may take several minutes, depending on the processing power of your computer.
3.07 As we promised in step one, you can now view the actual set of instructions and settings Honeybee sent to OpenStudio. These are contained in the OSM file, which you can find by connecting a panel to the osmFileAddress output.
3.08 Here is a portion of the OSM file. Note that Honeybee has filled in many of the default settings. For example, we have not yet set an analysis period, but the Begin Month of the simulation is 1 (January), and the End Month is 12 (December). If you open the file on your computer, you will see it is quite long, but this gives you an idea of this process.
Our main concern, however is the resultFile, which comes in the form of a .csv document, or comma separated values document. This format is commonly used for Excel spreadsheets, and next we will go through the process of parsing this spreadsheet to get the information we need to create an Energy Balance diagram in Step 4.
